Rolling Returns, Sharpe Ratio and Standard Deviation Made Simple
Last updated: 13 October 2026
Quick answer: Rolling returns show how consistently a fund has performed across many overlapping periods, not just from one start date. Standard deviation measures how much returns swing. The Sharpe ratio divides return above the risk-free rate by standard deviation, so it shows return earned per unit of risk. Use them together, within one category and one time window, to compare funds.
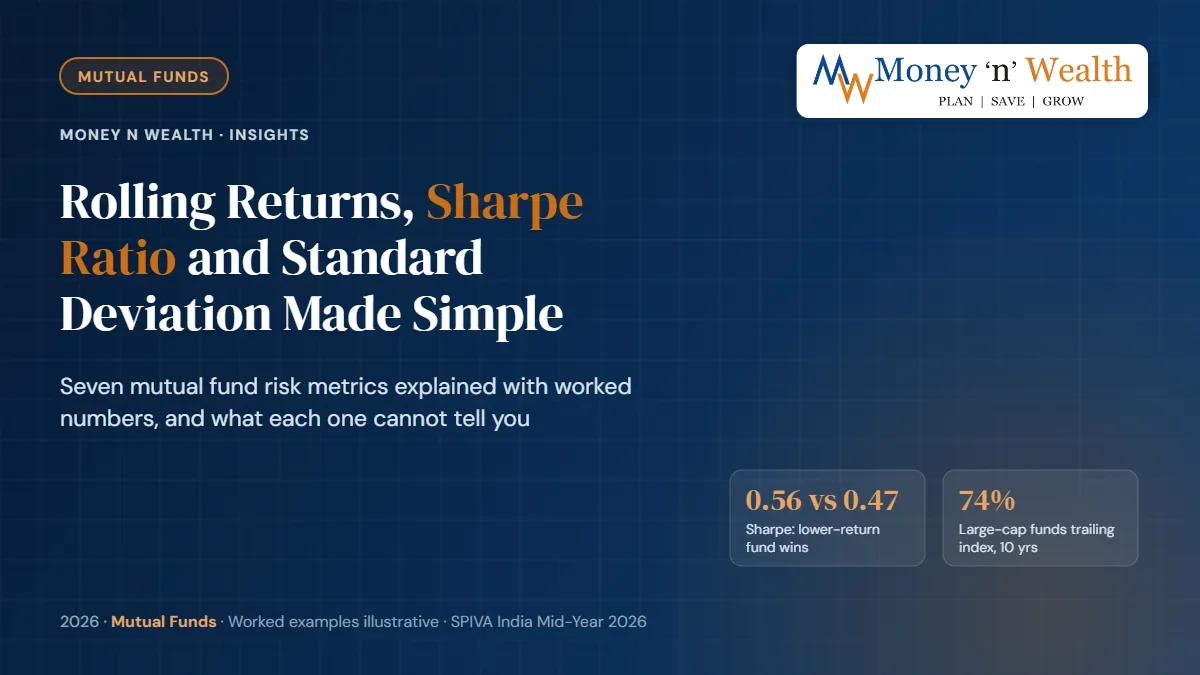
Last updated: 13 October 2026 Quick answer: Rolling returns show how consistently a fund has performed across many overlapping periods, not just from one start date. Standard deviation measures how much returns swing. The Sharpe ratio divides return above the risk-free rate by standard deviation, so it shows return earned per unit of risk. Use them together, within one category and one time window, to compare funds. Key takeaways Rolling returns: in our example, a fund with an 18.8% latest 3-year return beat its index in only 3 of 8 windows. Sharpe ratio: a fund earning 11.0% scored 0.56, ahead of a 12.8% fund at 0.47, because it took far less risk. Standard deviation: roughly two-thirds of years fall within one standard deviation of the average, if returns are near-normal. Capture ratios: downside capture of 50 means the fund lost half as much as its index in down periods. Context: SPIVA India data to June 2026 shows 74% of large-cap active funds trailed their benchmark over 10 years. Two investors look at the same factsheet page. One sees a fund with an 18.8% three-year return and wants to invest. The other notices that this fund trailed its index in most earlier three-year periods and only looks good because of the last stretch. Both are reading true numbers. Only one is reading the right ones. This guide explains, in plain language, the metrics that sit in the "risk ratios" box of every equity fund factsheet: rolling returns, standard deviation, the Sharpe ratio, the Sortino ratio, beta, alpha, R-squared, the information ratio and upside/downside capture. Each comes with a worked example computed by Money n Wealth on hypothetical funds. None of this recommends any scheme; it is a toolkit for reading data, as of October 2026. What are rolling returns in mutual funds? Rolling returns are the annualised returns of a fund calculated over a fixed window, such as three or five years, for every possible start date over a longer history. Instead of one number, you get a distribution: the average, the best, the worst and how often the fund crossed a threshold. The return you see most often, the trailing or point-to-point return, uses only one start date and one end date, usually today. That makes it hostage to timing. If the market was at a low three years ago, every fund's three-year return looks strong. If it was at a peak, every fund looks weak. Our guide to XIRR vs CAGR vs absolute return (/insights/xirr-vs-cagr-vs-absolute-return) covers how those single-period figures are calculated. A worked rolling-return example Take an index and two hypothetical funds over ten years. We calculate the three-year CAGR for each of the eight possible windows (years 1–3, 2–4 and so on up to 8–10). Line chart of rolling returns for two hypothetical funds against an index, showing Fund P only beat the index in the latest three windows while Fund Q beat it in all eight Measure (3-year rolling) Fund P Index (TRI) Fund Q Latest 3-year return (trailing) 18.8% 9.8% 11.6% Average of 8 windows 7.4% 9.1% 11.4% Worst window 0.4% 5.7% 8.7% Best window 18.8% 11.1% 14.2% Windows beating the index 3 of 8 – 8 of 8 Full 10-year CAGR 8.7% 10.0% 12.2% On the trailing number, Fund P looks like the clear winner. On rolling returns, it was the weakest of the three for most of the decade, and its full ten-year CAGR is below the index. Fund Q never topped any single chart, yet it beat the index in every window. That is what consistency looks like. How to use rolling returns well Match the window to your horizon. Use three-year rolling returns for medium-term money and five- or seven-year windows for long-term equity goals. Look at the worst window, not just the average. It tells you what staying invested through a bad patch felt like. Compare against the benchmark's rolling returns. SEBI has required schemes to be benchmarked to the Total Return Index (TRI), which includes dividends, since 1 February 2018. Use daily or monthly start dates on real data. Research platforms usually roll daily; our yearly example is simplified. What does standard deviation tell you about a fund? Standard deviation measures how widely a fund's returns are spread around its average. A higher figure means a bumpier ride. Factsheets usually calculate it from 36 monthly returns and annualise it (multiply by the square root of 12). A rough rule helps: if returns are close to normally distributed, about two-thirds of outcomes fall within one standard deviation of the average, and about 95% within two. A fund averaging 12% with a standard deviation of 15% could plausibly return anywhere from −3% to 27% in a typical year, and worse in a bad one. Two limitations matter. First, standard deviation punishes upside surprises as much as downside ones. Second, market returns have fatter tails than a normal curve, so crashes like March 2020 happen more often than the maths implies. That is why you should also look at the worst rolling period and the maximum drawdown. How is the Sharpe ratio calculated? The Sharpe ratio , developed by Nobel laureate William Sharpe, is: Sharpe ratio = (Fund return − Risk-free rate) ÷ Standard deviation It answers one question: how much extra return did the fund earn for each unit of volatility it took on? Higher is better, but only when comparing funds in the same category over the same period. Indian AMC factsheets commonly use an overnight money-market rate (often FBIL Overnight MIBOR) as the risk-free rate, and they state the rate used in the footnotes. Worked example: Fund X vs Fund Y Below are five years of hypothetical annual returns for two funds in the same category and their index. We use a 6% risk-free rate. Year Fund X Fund Y Index 1 28% 20% 24% 2 −8% −3% −6% 3 22% 16% 18% 4 4% 8% 5% 5 18% 14% 15% Average return 12.8% 11.0% 11.2% CAGR 12.0% 10.7% 10.7% Standard deviation 14.6% 8.9% 11.8% Sharpe ratio 0.47 0.56 0.44 Sortino ratio 1.08 1.24 0.97 Fund X's Sharpe ratio is (12.8 − 6) ÷ 14.6 = 0.47. Fund Y's is (11.0 − 6) ÷ 8.9 = 0.56. Fund X earned more, but Fund Y earned more per unit of risk. If you would struggle to hold Fund X through its −8% year, Fund Y may be the better fit even with the lower headline return. Bar chart comparing average return, standard deviation, Sharpe ratio and Sortino ratio for two hypothetical funds and an index When the Sharpe ratio misleads Negative excess returns: when a fund earns less than the risk-free rate, a higher standard deviation can make the Sharpe ratio look less negative, which is misleading. Short history: many AMCs show risk ratios only for schemes with at least three years of data. Below that, the numbers are noise. Cross-category comparisons: a liquid fund will often show a high Sharpe ratio because its volatility is tiny. That says nothing about its suitability for a 15-year goal. Sharpe vs Sortino ratio: what is the difference? The Sortino ratio replaces standard deviation with downside deviation, which counts only returns below a target (here, the 6% risk-free rate). Investors rarely complain about upside volatility, so Sortino focuses on the swings that hurt. In our example, Fund X's returns fell below 6% in two years: by 14 points and 2 points. Squaring those, averaging over five years and taking the square root gives a downside deviation of 6.3%. Its Sortino ratio is 6.8 ÷ 6.3 = 1.08. Fund Y fell short only once, by 9 points, giving a downside deviation of 4.0% and a Sortino ratio of 1.24. Fund Y wins again, by a similar margin. What do beta, alpha and R-squared mean? Beta: how sensitive is the fund to the market? Beta measures how much a fund tends to move when its benchmark moves. A beta of 1.0 means it moves in line. Fund X's beta in our example is 1.23, so it tended to rise or fall about 23% more than the index. Fund Y's beta is 0.75. Beta is useful for diversified equity funds; it is less meaningful for sector funds measured against a broad index. Alpha: did the manager add value? Alpha (Jensen's alpha) is the return a fund earned above what its beta predicted. The formula is: fund return − [risk-free rate + beta × (benchmark return − risk-free rate)]. For Fund Y: 6 + 0.75 × (11.2 − 6) = 9.9% expected, against 11.0% earned, so alpha is about 1.1%. Fund X's alpha is only about 0.4%: most of its higher return came from taking more market risk, not from skill. This is why a high return alone is not evidence of a good manager. Alpha is hard to sustain. The SPIVA India Mid-Year 2026 Scorecard found that, to 30 June 2026, about 85% of large-cap active funds trailed the S&P India LargeMidCap index over five years and 74% over ten years. Over ten years, about 82% of mid- and small-cap funds and 80% of ELSS funds trailed their benchmarks. If you are paying for active management, alpha is what you are paying for. Our page on index funds (/insights/index-funds) covers the passive alternative. R-squared: can you trust the beta and alpha? R-squared (0 to 1, or 0 to 100) shows how much of a fund's movement is explained by its benchmark. Above about 0.8, beta and alpha are meaningful. A low R-squared means the benchmark is a poor fit, so treat beta and alpha with caution. A very high R-squared with a high expense ratio can signal a "closet index" fund. What are upside and downside capture ratios? Capture ratios compare a fund's returns with its benchmark's in rising and falling periods separately. Morningstar describes upside capture as performance in months when the benchmark rose and downside capture as performance in months when it fell. A score of 100 means the fund moved exactly with the index. Bar chart of upside and downside capture ratios for two hypothetical mutual funds In our simplified example, the index had one down year (−6%). Fund X fell 8%, a downside capture of 133. Fund Y fell 3%, a downside capture of 50. In up years, Fund X captured 116% of the index's average gain and Fund Y 94%. The ideal is upside above 100 and downside below 100, but few funds manage both for long. Many investors who say they want high returns actually behave as if they want low downside capture, because a deep fall is what makes people stop their SIPs. See should you stop your SIP when markets fall (/insights/should-you-stop-sip-when-markets-fall) . Information ratio, tracking error and maximum drawdown Tracking error is the standard deviation of the difference between fund and benchmark returns. For index funds and ETFs it should be very low; see ETFs vs index funds (/insights/etf-vs-index-fund-india) . Information ratio = (fund return − benchmark return) ÷ tracking error. It shows whether outperformance was steady or came from a few lucky bets. Fund X's information ratio is about 0.56; Fund Y's is roughly zero, because its average return matched the index while taking less risk. Maximum drawdown is the largest fall from a peak to a trough. Many factsheets do not show it, but research platforms do. It is the most intuitive risk number: "How much could I have lost on paper?" Cheat sheet grouping rolling returns, alpha, standard deviation, beta, Sharpe ratio, Sortino ratio and capture ratios by the question each answers How to use these metrics to compare mutual funds Treat the ratios as a screen, not a verdict. A practical order: Pick the category first. Compare a flexi-cap fund only with other flexi-cap funds. Our SIP fund shortlisting framework (/insights/how-to-shortlist-sip-funds-2026) explains this step. Check rolling returns against the TRI. Look at the percentage of windows beating the benchmark and the worst window. Check risk. Standard deviation, beta and, where available, maximum drawdown versus category peers. Check risk-adjusted return. Sharpe and Sortino ratios over the same period for all funds being compared. Check behaviour. Downside capture tells you whether the fund has cushioned falls. Confirm the data window. Make sure every number comes from the same end date and the same period length. Then step back from the numbers. Every ratio here is backward-looking. A manager change, a sharp rise in fund size or a change in mandate can make a good history irrelevant. Our guide on how to read a mutual fund factsheet (/insights/how-to-read-mutual-fund-factsheet) shows where each of these items appears. Common mistakes when reading fund ratios Comparing across periods. A Sharpe ratio for the three years to March 2026 cannot be compared with one for the three years to September 2026. Ignoring the risk-free rate used. AMCs state it in factsheet footnotes; it shifts with interest rates. After the RBI raised the repo rate to 5.50% on 7 October 2026, money-market rates moved up too. Chasing one ratio. A fund optimised for a high Sharpe ratio may hold a lot of cash and lag in strong markets. Forgetting costs. Factsheet returns for regular plans are after expenses, but direct and regular plans of the same fund show different numbers. See expense ratio and other costs (/insights/mutual-fund-expense-ratio-exit-load-costs) . Treating style cycles as skill. Value or momentum styles go in and out of favour for years. Our factor funds guide (/insights/smart-beta-factor-funds-india) explains why. Related reading How to Shortlist SIP Funds in 2026: A Screening Framework (/insights/how-to-shortlist-sip-funds-2026) How to Read a Mutual Fund Factsheet (/insights/how-to-read-mutual-fund-factsheet) XIRR vs CAGR vs Absolute Return (/insights/xirr-vs-cagr-vs-absolute-return) How to Choose Mutual Funds: A Portfolio-First Framework (/insights/how-to-choose-mutual-funds-portfolio-framework) 7 Signs Your Mutual Fund Portfolio Needs a Review (/insights/signs-your-mutual-fund-portfolio-needs-a-review) Frequently Asked Questions What is a good Sharpe ratio for an Indian equity mutual fund? There is no universal cut-off, because the ratio depends heavily on the period measured. In a strong three-year market, many equity funds show ratios above 1; after a correction, most fall sharply. The useful test is relative: compare a fund's Sharpe ratio with its category peers and its benchmark over the same period and the same risk-free rate. Consistently above the category median is a good sign. Are rolling returns better than trailing returns? For judging consistency, yes. Trailing returns depend on one start and end date, so they can flatter or punish a fund because of market timing. Rolling returns calculate the return for every possible start date within a long history, showing the average, range and frequency of beating the benchmark. Use trailing returns to know recent performance and rolling returns to judge reliability. Is a lower standard deviation always better? Not by itself. Lower standard deviation means smoother returns, but a fund can achieve it by holding cash or defensive stocks and then lag in rising markets. Look at standard deviation together with return: the Sharpe and Sortino ratios do this for you. Also compare only within the same category, since a large-cap fund will naturally swing less than a small-cap fund. What is the difference between alpha and beta? Beta measures how sensitive a fund is to its benchmark's movements; 1.2 means about 20% more movement than the index. Alpha measures the return earned beyond what that market sensitivity would predict, after allowing for the risk-free rate. Beta describes risk taken; alpha estimates value added by the manager. Both are reliable only when R-squared is reasonably high. Where can I find rolling returns and risk ratios for my fund? The AMC's monthly factsheet usually shows standard deviation, beta, Sharpe ratio and portfolio turnover for schemes with at least three years of history. Rolling returns and capture ratios are typically on independent research platforms or available from your distributor's tools. Always check the period, the benchmark and the risk-free rate stated in the footnotes. What does a downside capture ratio of 80 mean? It means that, in periods when the benchmark fell, the fund fell about 80% as much on average. If the index dropped 10%, the fund would typically have dropped around 8%. A downside capture below 100 shows the fund has cushioned falls in the past, but it is not a guarantee for the next correction. Why do factsheets need three years of data for risk ratios? With fewer than about 36 monthly returns, standard deviation, beta and Sharpe ratio are statistically unstable and can swing widely with one good or bad month. Many AMCs therefore show these ratios only once a scheme has a three-year record. For newer funds, rely more on the portfolio, mandate and manager's record elsewhere. Sources: S&P Dow Jones Indices, SPIVA India Mid-Year 2026 (https://www.spglobal.com/spdji/en/spiva/article/spiva-india/) ; SPIVA India Mid-Year 2026 Scorecard (PDF) (https://www.spglobal.com/spdji/en/documents/spiva/spiva-india-scorecard-mid-year-2026.pdf) ; SEBI circular on benchmarking to Total Return Index, 4 January 2018 (https://www.sebi.gov.in/sebi_data/attachdocs/jan-2018/1515066187290.pdf) ; Morningstar India, upside and downside capture ratios (https://www.morningstar.in/posts/13050/what-upside-and-downside-capture-ratios-mean.aspx) ; Example AMC factsheet notes on risk-ratio methodology (April 2026) (https://digitalassets.canararobeco.com/digital-factsheet/2026/april/Disclaimer.html) . Worked examples are Money n Wealth calculations on hypothetical funds. Not sure what your fund's ratios are telling you? The same numbers can point to very different decisions depending on your goals and risk tolerance. Talk to Money n Wealth (/contact) for a free portfolio review. This article is for general educational purposes only and does not constitute financial advice. Figures and examples are illustrative. Please consult a qualified financial adviser for guidance specific to your situation. Money n Wealth (Predics Fintech Services Pvt Ltd) is an AMFI-registered Mutual Fund Distributor (ARN-121995) and APMI-registered PMS Distributor (APRN07444); it is not a SEBI-registered investment adviser and may earn distribution commission on investments made through it.
Frequently Asked Questions
What is a good Sharpe ratio for an Indian equity mutual fund?
There is no universal cut-off, because the ratio depends heavily on the period measured. In a strong three-year market, many equity funds show ratios above 1; after a correction, most fall sharply. The useful test is relative: compare a fund's Sharpe ratio with its category peers and its benchmark over the same period and the same risk-free rate. Consistently above the category median is a good sign.
Are rolling returns better than trailing returns?
For judging consistency, yes. Trailing returns depend on one start and end date, so they can flatter or punish a fund because of market timing. Rolling returns calculate the return for every possible start date within a long history, showing the average, range and frequency of beating the benchmark. Use trailing returns to know recent performance and rolling returns to judge reliability.
Is a lower standard deviation always better?
Not by itself. Lower standard deviation means smoother returns, but a fund can achieve it by holding cash or defensive stocks and then lag in rising markets. Look at standard deviation together with return: the Sharpe and Sortino ratios do this for you. Also compare only within the same category, since a large-cap fund will naturally swing less than a small-cap fund.
What is the difference between alpha and beta?
Beta measures how sensitive a fund is to its benchmark's movements; 1.2 means about 20% more movement than the index. Alpha measures the return earned beyond what that market sensitivity would predict, after allowing for the risk-free rate. Beta describes risk taken; alpha estimates value added by the manager. Both are reliable only when R-squared is reasonably high.
Where can I find rolling returns and risk ratios for my fund?
The AMC's monthly factsheet usually shows standard deviation, beta, Sharpe ratio and portfolio turnover for schemes with at least three years of history. Rolling returns and capture ratios are typically on independent research platforms or available from your distributor's tools. Always check the period, the benchmark and the risk-free rate stated in the footnotes.
What does a downside capture ratio of 80 mean?
It means that, in periods when the benchmark fell, the fund fell about 80% as much on average. If the index dropped 10%, the fund would typically have dropped around 8%. A downside capture below 100 shows the fund has cushioned falls in the past, but it is not a guarantee for the next correction.
Why do factsheets need three years of data for risk ratios?
With fewer than about 36 monthly returns, standard deviation, beta and Sharpe ratio are statistically unstable and can swing widely with one good or bad month. Many AMCs therefore show these ratios only once a scheme has a three-year record. For newer funds, rely more on the portfolio, mandate and manager's record elsewhere.
Not sure what your fund's ratios are telling you?
The same numbers can point to very different decisions depending on your goals and risk tolerance. Talk to Money n Wealth for a free portfolio review.